Large areas of pit wall can be captured easily and safely simply by photographing them.
Data can be obtained remotely when there is no safe access (from up to 3km away!).
Features can be identified that would otherwise not be apparent when working too close to the rock face.
The data can be generated very rapidly compared to other techniques.
The accuracy and detail of the data is high compared to other techniques, as well as being configurable to a much higher degree than other techniques.
Traces are easy to identify and digitise, unlike techniques that use a point cloud, even if it is colourised.
Acquiring the data has little impact on mining activities.
The data can be acquired in a wide range of climactic conditions.
The images form a permanent record that can be referred back to in the future for reporting and legal issues.
The physical component of the system, the digital camera — which is the only part that can break down — is relatively cheap, available from many suppliers, and easy to replace.
Workflow
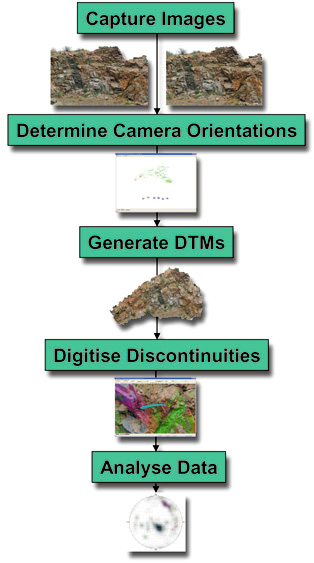
The first step is to acquire images of the scene to be mapped. 3DM Analyst Mine Mapping Suite is very flexible when it comes to the configuration of the images, and the software will usually be able to automatically determine the relative position and orientation of the camera when each image was captured completely automatically.
(Tip: It is useful to carry a notebook into the field and load the images onto the notebook when they are captured. Within a few minutes of automatic processing of the images you will be able to tell if any images need to be recaptured. If you are using a Canon digital camera you can even connect it to the notebook and acquire the images directly from within the software, which will automatically add them to the project and attempt to match them with existing images as they are captured.)
Once the relative orientations have been determined automatically by the software, the next step is to georeference the data in a real-world co-ordinate system. This can be done by digitising control points and/or specifying camera stations, or by using a vertical scale bar, a hand-held GPS receiver, and a compass. The absolute orientation is determined simultaneously for all images, taking into account the specified accuracy of all data presented to the system.
For a small project consisting of roughly 10 images this entire process will take a few minutes at the most. For a large project with hundreds of images it can take a few hours; even in that case, however, the vast majority of the time is spent processing without operator intervention.
At this stage the software will generate a report that indicates how accurate the generated data should be and whether any of the control points and/or camera stations have bad data.
The next step is to generate surface models (DTMs) for the entire project. In the full version of the software this can be batch-processed so user time is not wasted; on a modern notebook or desktop PC approximately 3,000 points per second can be generated.
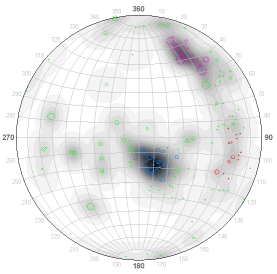
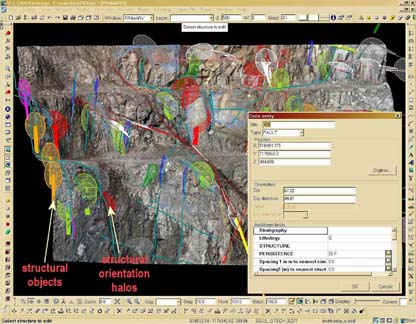
Once complete, the DTMs are ready for analysis — planar discontinuities can be digitised both manually and automatically (Figure 2), features can be assigned to sets (Figure 3), and profiles generated through the DTM both parallel to the feature (traces) or perpendicular to the feature in the dip direction (faces). Spacing can also be measured, and comments added to each feature if desired. The resulting information can be exported as a text file, an HTML report, or a CSV file for importing into other packages like Rocscience's Dips for further analysis.
Click the buttons to view fullscreen or on YouTube for more details.
The software also allows the DTMs to be exported as 3D Images for importing into a range of other packages, like Maptek's VULCAN, for analysis.
Typical accuracies reported by customers range from 0.02 m from 50 m away using a 28 mm lens, up to 0.1 m from 2.8 km away using a 300 mm lens!
For more detailed information, please read the paper ADAM Technology submitted for the Golden Rocks 2006 workshop.
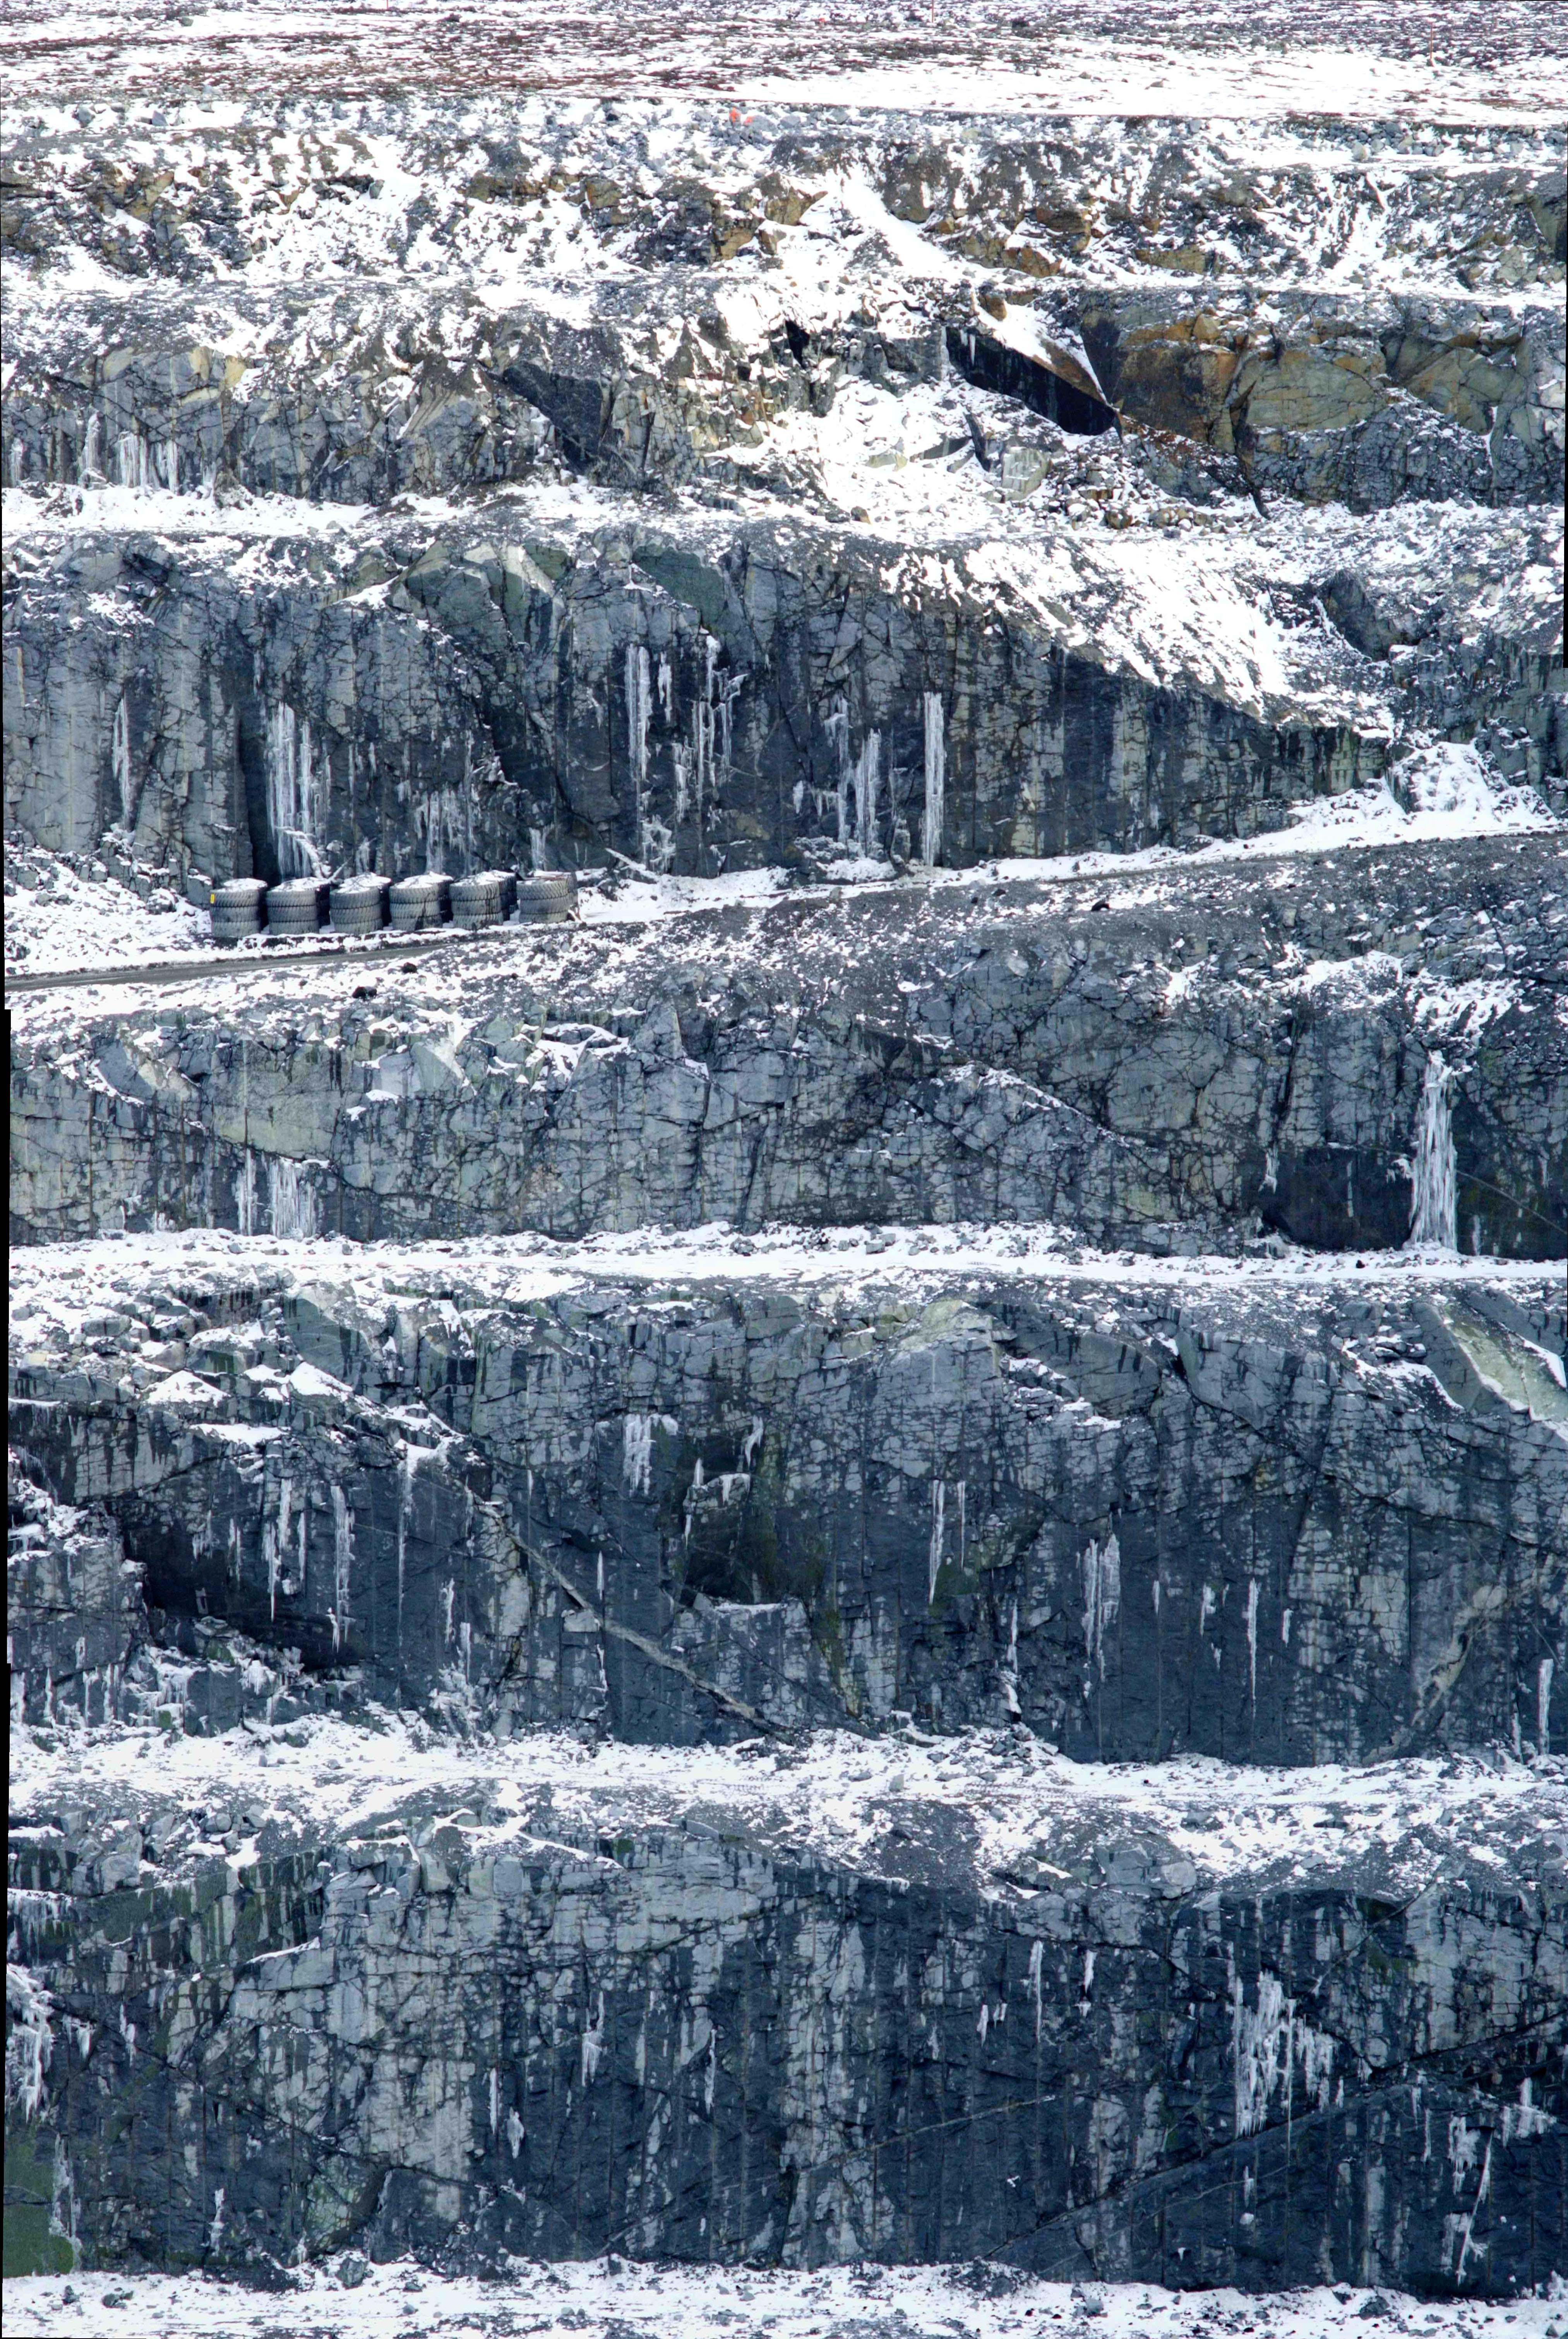
Case Study
Ekati Diamond Mine, situated 200 km south of the Arctic Circle, is BHP Billiton's only diamond mine. The extreme weather conditions make field work challenging and highlight the importance of safe data collection techniques.
Using a Nikon D1x with a 135 mm lens from 680 m away on the opposite side of the pit, the user is able to capture a 500 m x 250 m section of pit wall, representing about 1/3rd of the pit, from just two locations. (See Figure 4 — red points in the image are common points between images automatically generated by 3DM CalibCam to establish the precise relationship between the images.)
By mounting the camera on a tripod and panning it up and down to create image fans the pit wall can be captured at a ground pixel size of 3 cm x 3 cm (for a detailed structural analysis) within a few minutes. Thanks to the use of 3DM CalibCam to calculate camera orientations, seven permanent ground control points placed around the outside rim of the pit are enough to provide data accurate to 0.1 m all the way down to the pit floor without any need to place control points there.
Using 3DM CalibCam's ability to merge images captured from the same location into high-resolution, distortion-free and colour-balanced images means the photographer does not need to care about whether images from one camera station line up with the corresponding images from the other camera station to form stereo pairs, further simplifying field work and reducing field times. (See Figure 5 — merged images of up to 65 megapixels can be used with 3DM Analyst, and up to 250 megapixels with 3DM Analyst Professional. Click on the image to download a high-resolution version.)
Once the images have been acquired they can be transferred to the PC back in the office and 3DM CalibCam used to automatically generate common points between images without user intervention. Control points can then be digitised and a block adjustment performed to determine the precise camera orientations. 3DM CalibCam can then be used to create one or more merged images if desired, as well as project files for 3DM Analyst and DTM Generator to generate the DTMs, again without user intevention.
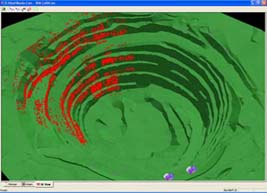
As the DTMs are being generated they can also be automatically converted into 3D Images for importing directly into VULCAN for geotechnical analysis (Figure 6).
For the 125,000 square metre section of pit wall described above, the entire process from start to finish takes less than three hours on 2.4 GHz PC to generate 7.1 million points; only six minutes of that time is actual user time — the rest of the time the computer is working fully autonomously, allowing staff to continue working on other projects while the computer generates the data.