This page summarises published papers and independent reports from various organisations that have been generous enough to make their findings available.
Please contact ADAM Technology if you are having difficulty obtaining a copy of these reports.
University of Western Australia and Glencore Mount Isa Mines
| Paper: | An instrumentation project to investigate the response of a ground support system to stoping induced deformation |
|---|---|
| Date: | September, 2016 |
| Abstract | As a sub-project of the industry-sponsored Ground Support Systems Optimisation Project being delivered by the Australian Centre for Geomechanics (University of Western Australia), an instrumented trial has been carried out at George Fisher Mine (part of Glencore’s Mount Isa Mines operation) Mount Isa, Queensland, Australia. The aim of the trial was firstly to measure the response of a ground support system to mining related excavation in close proximity and secondly to replicate that response by means of a numerical model. This paper deals with the trial site, instrumentation and data acquired. Displacement measurements were taken using a tape extensometer and also by means of photogrammetry. An array of SMART™ cables was used to determine support load distributions and extents of the deformation zone. Fibrecrete liner load was measured by means of vibrating wire strain gauges embedded in the liner. Observation holes were used to verify the extent of the fracture zone around the trial site excavations. Displacements, loads and strains were tracked by manual and automated data retrieval methods and are presented in the paper. A discussion of the results and their implication for numerical modelling of ground support is presented. |
| Summary: |
Four different monitoring methods were used to provide parameters that were easily measurable in the field as well as in numerical models:
3DM Analyst Mine Mapping Suite and its associated Underground Field Kit (Figure 1) were selected as the photogrammetric system to use for measuring tunnel skin deformation. 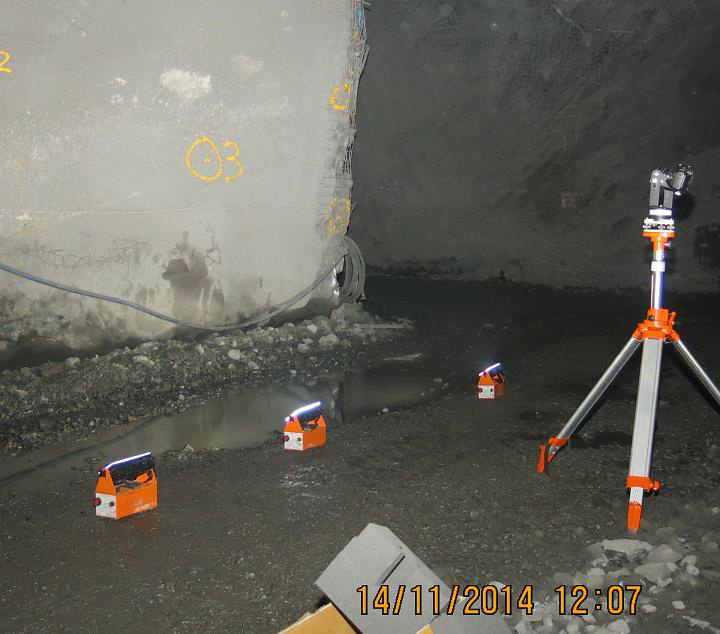
Figure 1. Photogrammetry field setup, consisting of tripod mounted digital camera and floodlighting.
All measurement systems were able to detect convergence, although 3DM Analyst detected more convergence than the others and was found to be sensitive to the control point specification, as would be expected if control points were the sole method being used to georeference the surfaces at different epochs. (ADAM recommends tying projects together using relative-only points when higher relative accuracy is required, as is often the case with monitoring projects.) The paper found that further work was required on the control point survey methodology. 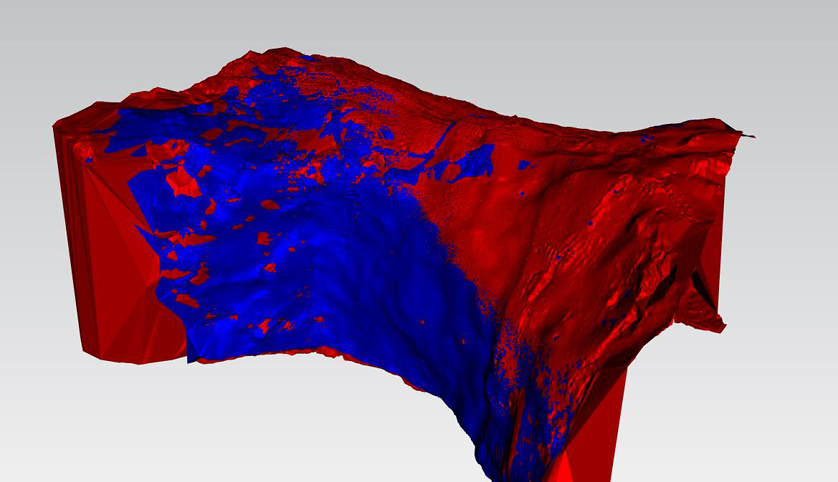
Figure 2. Superimposed photogrammetry surface models indicating areas of convergence.
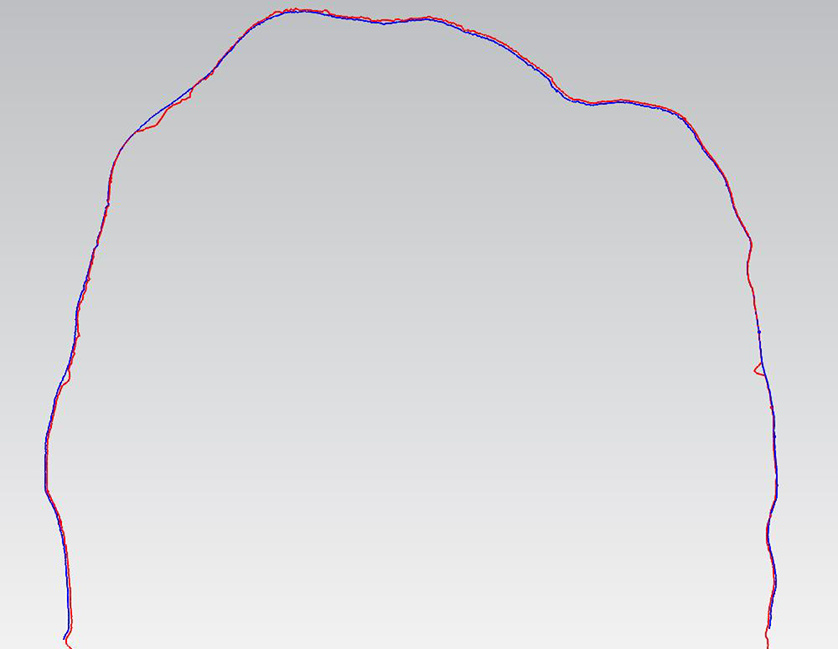
Figure 3. Cross-section through the surface models showing relative deformation.
The paper concludes:
|
| Reference: | Sweby, G, Dight, P, Potvin, Y & Gamble, N 2016, An instrumentation project to investigate the response of a ground support system to stoping induced formation. in E Nordlund, TH Jones & A Eitzenberger (eds), 8th International Symposium on Ground Support in Mining and Underground Construction, Lulea, Sweden, 12-14 September. |
Xstrata Cosmos Nickel Mine
| Paper: | The Benefits of using Photogrammetry in the Geological Interpretation of the Cosmos Nickel Mine |
|---|---|
| Date: | March, 2012 |
| Abstract | In the ideal world of an underground mining engineer, all narrow vein orebodies would be perfectly straight and continuous, thus would be a dream to mine. However, this is usually not the case. Narrow vein orebodies generally occur in association with shear zones and while shear zones do form linear trends, they most commonly preserve undulating expressions that need to be closely monitored, particularly when overprinted by post-formed structures. The surge in mines using fibrecrete as a primary form of ground support effectively reduces the time available for geological interpretation down to a 30 minute window between bogging and shotcreting. Thus, if the quality of the data collected is not up to scratch, then there is only a limited ability to reassess using 2D face photographs. To negate this, Xstrata Nickel Australasia's Cosmos mine has upgraded its data collection procedure. Geological information is now collected using photogrammetry survey, producing 3D images of the drive. Once created, the digital image of the drive is loaded into Vulcan, thus enabling geological interpretation to be carried out along entire drives, between levels and in association with all other data (eg drill holes, seismic data, etc). In addition to this, the 3D image can be used to accurately model the location of the ore, enabling stoping panels to be confidently positioned to maximise grade and minimise dilution. However, with the focus at Cosmos changing from narrow vein mining, to bulk mining methods in a more geotechnically complex terrain, the use of the 3D images has become paramount in understanding the structural geometry. Continual interpretation of the data has enabled drive profiles to be maintained through the increased use of ground support in poor ground and the redesign of development to enable optimal intersection of structures. Nevertheless, while the collection of quality data is important, it is only the effective use of the data, which enables significant gains in understanding. |
| Summary: |
The paper and associated presentation explore several uses of the 3D data generated by 3DM Analyst Mine Mapping Suite, including using it to update the structural models:
Convergence monitoring is also mentioned: 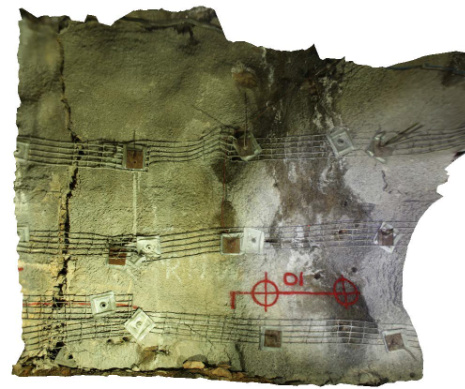
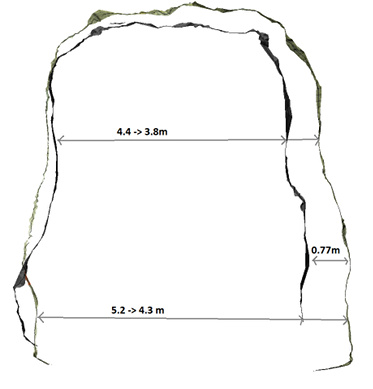
Figure 1. Convergence monitoring.
The paper concludes:
|
| Reference: | Rees, K, 2012. The Benefits of using Photogrammetry in the Geological Interpretation of the Cosmos Nickel Mine, in Proceedings Narrow Vein Mining 2012, pp.145-148 (The Australasian Institute of Mining and Metallurgy: Melbourne). |
Gannett Fleming, Inc. and the Pennsylvania Department of Transportation
| Paper: | Application of Digital Photogrammetry to Rock Cut Slope Design |
|---|---|
| Date: | January, 2012 |
| Abstract |
To reduce future maintenance along a rockfall-prone stretch of U.S. Highway 15 on Bald Eagle Mountain near South Williamsport, the Pennsylvania Department of Transportation proposed to remove an existing rockfall fence and modify the existing cut to provide a rock catchment ditch in order to mitigate the rockfall hazard. Digital photographs were used to develop a three-dimensional, digital model encompassing a 420-foot-long section of the existing rock cut. The orientations of 238 rock discontinuities visible in the model were measured. A Brunton Geotransit was used to collect additional measurements from behind the rockfall fence and to validate the model measurements. Discontinuity measurements were used to analyze the potential for plane, toppling, and wedge failures, to assess the variability of dip angle and dip direction along the alignment, and to optimize the azimuth of horizontal drain holes. The digital model was used to locate the possible outcrop of clay seams encountered in rock core borings. Using digital photogrammetry permitted measurement of discontinuities in higher parts of the outcrop without rappelling or free-climbing. A great volume of data was collected in a short period of time, reducing exposure to rockfalls and traffic. Discontinuities were measured over a greater area of their extent, and discontinuities having limited surface exposure were measured by digitizing their trace across the outcrop. Using digital photogrammetry reduced the potential for human error in the collection, recording, and processing of data, and facilitated performance of some of the analyses required for designing a safer rock cut slope. |
| Summary: |
A single strip of nine images were captured 50 m from the rock face with a 50 mm lens: 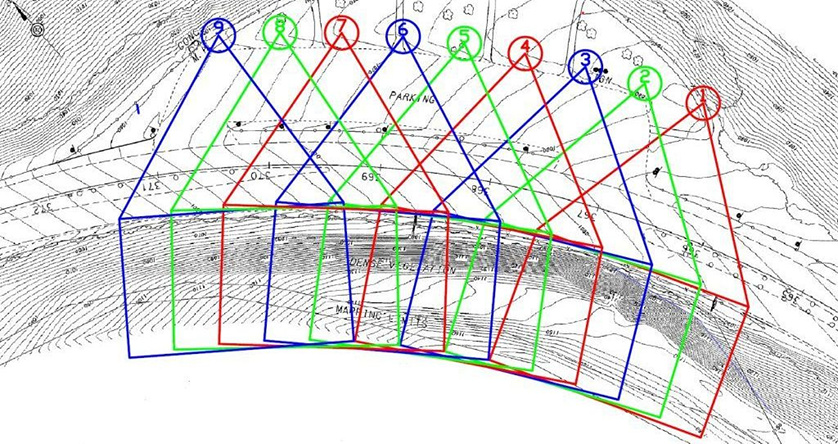
Figure 1. Project plan.
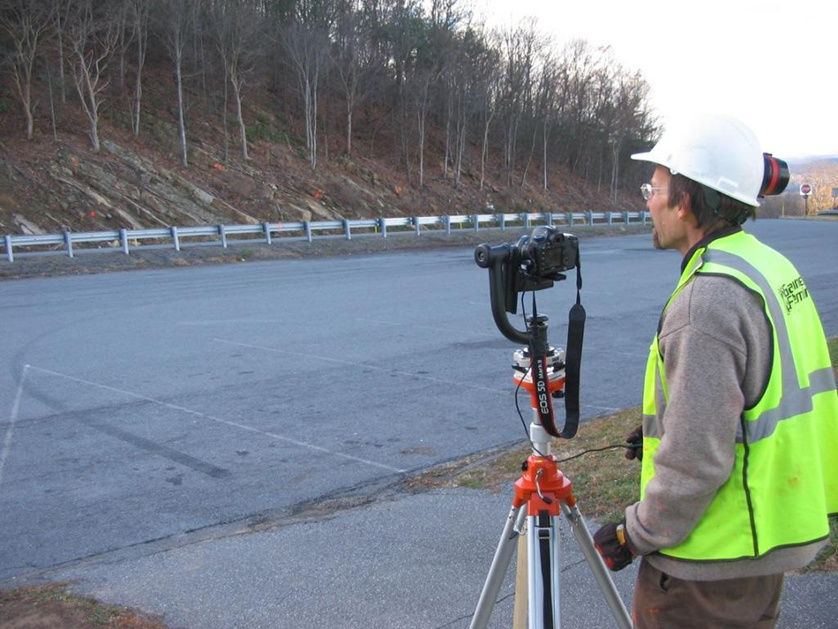
Figure 2. Photographing the rock face.
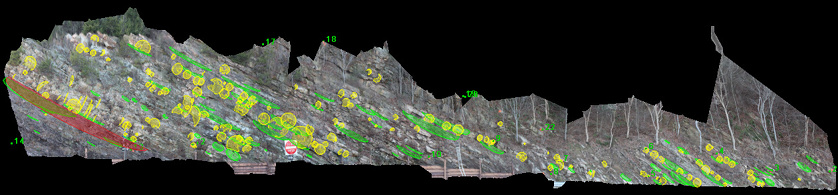
Figure 3. Mapped structures.
The paper concludes:
|
| Reference: | Roman, M, and Johnson, R, 2012. Application of Digital Photogrammetry to Rock Cut Slope Design, in Proceedings of the Transporation Research Board 91st Annual Meeting. Available online. |
Golden Rocks Workshop Report
| Report: | Laser and Photogrammetric Methods for Rock Face Characterisation |
|---|---|
| Date: | May, 2007 |
| Summary: |
At the Golden Rocks conference in 2006 a workshop was conducted to investigate the state-of-the-art in laser scanning and photogrammetric methods for rock face characterisation. Vendors were required to demonstrate how a 3D model of a rock face could be captured using their systems during the workshop, and were required to submit an analysis of the rock face to the organisers for review in November, 2006. ADAM Technology was the only vendor who created the 3D model of the entire rock face in real-world co-ordinates during the workshop — in fact, we did it twice, using two different lenses and two different techniques to show they delivered the same result. It took just over 10 minutes using one technique and just over 20 minutes using the other. ADAM Technology was also the only vendor who submitted the analysis by the original deadline. The deadline was extended by three months and even then only one other vendor submitted any data at all. The organisers evaluated the submitted data and found that when compared with 12 control points not used for orientations, ADAM's terrain model was three times more accurate on average (with the largest error being 1/5th as large) and four times more dense, but required just 1/9th the time to generate (90 minutes vs less than 11 minutes). 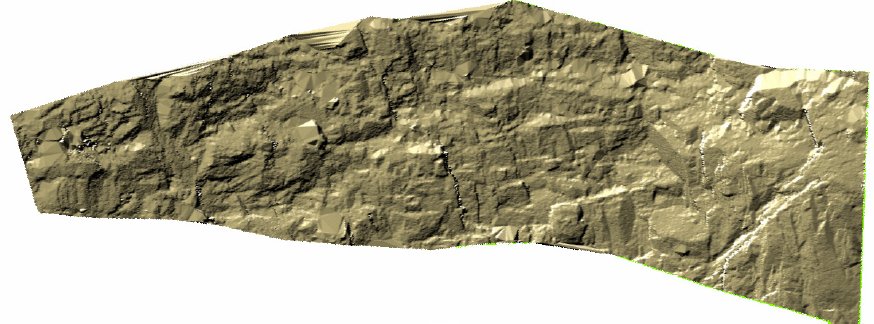
Figure 1. 3DM Analyst's terrain model.
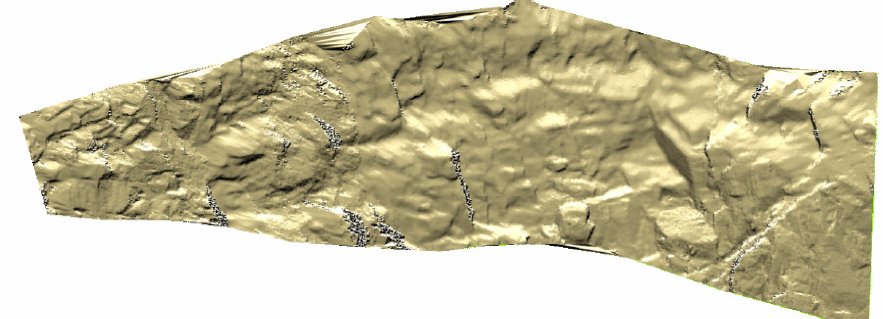
Figure 2. Other vendor's terrain model.
Thanks to the "averaging" nature of discontinuity orientation measurements, however, where many DTM points are used and the best fit plane found, the actual joint orientations, set means, and trace lengths agreed extremely well. The organisers concluded that "the obtained results indicate that digital photogrammetry yields reliable and reproducible results when applied to rock mass characterization. Digital photogrammetry is thus a mature enough technology that can be used with confidence in the profession provided care is taken to follow the guidelines provided by the Presenters in their papers and by the authors in the introductory paper to this report." |
Rio Tinto Iron Ore
| Report: | Comparison of photogrammetric software — SIRO Vision and ADAM Technology |
|---|---|
| Date: | February, 2007 |
| Summary: |
In early 2007 Rio Tinto Iron Ore conducted a trial to compare 3DM Analyst Mine Mapping Suite with Sirovision, which they had been using for geotechnical engineering for several years. Despite the extensive experience they already had using Sirovision, and just a couple of hours of training on 3DM Analyst, they found that:
They also reported:
Please contact ADAM Technology for a copy of this report. |
Zostrich Geotechnical
| Report: | Geologic Structure Mapping using Digital Photogrammetry |
|---|---|
| Date: | May, 2006 |
| Summary: |
In 2006 Zostrich Geotechnical published a presentation comparing digital photogrammetry using 3DM Analyst to standard geologic mapping techniques. They found that a job requiring a total of 36 staff-hours could be completed using 3DM Analyst in just 3.5 hours. They also observed that by using the 3D view of the DTM in the software, "The engineer can safely examine the potential failure area in great detail from a multitude of angles. It is possible to literally 'fly' around and above potential rock failure blocks, even those in active failure. [...] While physical examination of the block may be required at some point, this method allows for detailed examination and analysis of the situation without the rock scaling and rope work normally required to assess the situation." They concluded:
|
Roche Mining
| Report: | 3DM CalibCam and 3DM Analyst Package Report |
|---|---|
| Date: | February, 2005 |
| Summary: |
In early 2005 Roche Mining conducted a trial to evaluate the suitability of 3DM Analyst Mine Mapping Suite for highwall coal seam mapping, dump profiling, and blast profile mapping. They compared the results using a range of different cameras, from the Canon EOS 10D digital SLR down to $300 compact digital cameras, as well as a laser scanner being operated by an independent contractor. They found that the 3DM Analyst data was within 0.3% of the values obtained using conventional surveying techniques, while the laser scanner was only within 1.2%. The author reported in private correspondence that the fieldwork for the laser scanning was 3–4 hours with two people plus 30 minutes of processing, while the fieldwork for 3DM Analyst was 2 hours for one person (capturing photographs using multiple techniques and using many more control points than usual, for testing) plus 1.5 hours of processing. Reprocessing those same images two years later, with the latest version of the software on a current PC, takes only 20 minutes — a five-fold improvement in productivity! This is one of the big advantages of a software-based system that relies on cheap and readily-upgraded hardware over a technology that relies on expensive instruments, like laser scanning does — every year the system gets better, rather than increasingly obsolete. |
BMA Coal
| Report: | Abridged Report on Field Test of New Safe Highwall Mapping Technologies for BMA, Goonyella Mine |
|---|---|
| Date: | May, 2004 |
| Summary: |
In 2004 BHP Billiton-Mitsubishi Alliance (BMA) conducted a trial to compare 3DM Analyst with Sirovision for the purpose of surveying for resource model/reconciliation, highwall mapping (lithology, geology, selected horizons), and resource modelling (top/bottom of seams, horizons, faults, dykes). Each vendor was invited onsite for a day to perform the field work and was later required to submit their data for comparison. Both teams used identical cameras (Nikon D1x's, both originally supplied by the CSIRO) and identical lenses for the main portion of the trial, allowing direct comparisons between the two packages to be made. The result is an incredibly extensive report on the outcome of this trial. Using identical cameras and lenses the 3DM Analyst data was found to be over twice as accurate on average, with the largest error being less than 1/3rd the largest error of Sirovision. The vertical accuracy was 3.4 times better. The report also states:
The report concludes:
The report also makes a number of recommendations for further enhancements, noting that "During the test period a number of recommendations were made to make the 3DM Analyst software more suitable for large mapping projects outlined in the scope of work. Adam Technology was very proactive and started working on the recommendations immediately. As a result, the software has improved significantly. Some of the remaining enhancement suggestions are listed here." ADAM is very proud of the fact that every one of the recommended enhancements were added to the software within two months of the report's release! The download includes the original report, a PowerPoint presentation containing the figures referred to in the report, and ADAM's own report on the trial, referred to in the BMA report as "Appendix 4". |