In Part 1 I looked at the accuracy that photogrammetry was capable of in real-life situations.
In Part 2 I looked at how you can predict the accuracy that will be achieved for a given project, taking into account the working distance, the camera and lens combination, and the geometry of the camera setups.
In Part 3 I’ll look at how much effort is required to achieve a given level of accuracy. This is critically important because although something may be possible in theory, if the effort required in practice is excessive then it may as well be impossible.
Case Study 1: Image Fans, Painted Control
Fieldwork
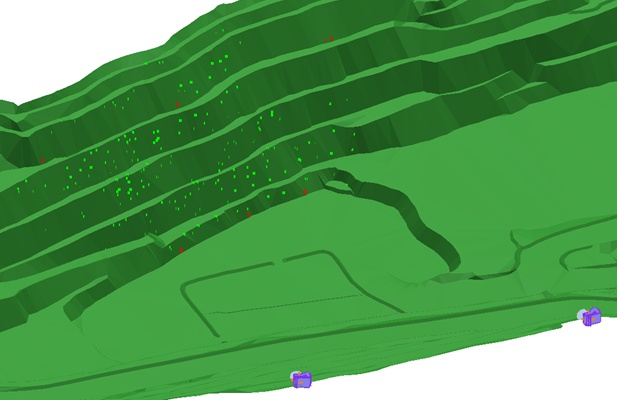
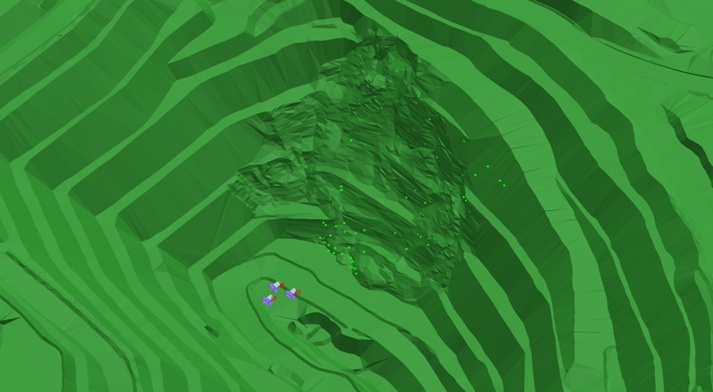
In this first example, the objective was to capture a section of pit wall for geotechnical analysis. The project area was 390 m × 190 m. A Canon EOS 5D with 100 mm lens gave a 4 cm ground pixel size at a range of 450 m, which was the distance from the wall to the crest on the opposite side of the pit — a good vantage point because it gave a clear view of the entire surface.
The camera stations were 290 m apart, giving a base:distance ratio of 1:1.6. This is slightly further apart than we normally recommend but since the wall is relatively flat it didn’t cause any problems with occlusion or image matching.
Six images were captured at each station — two rows of three images each. It took less than 30 seconds to capture the six images, and about a minute to set up the tripod with the camera and panoramic camera mount on it. It took about 8 minutes to walk from one camera station to the other. Total time to capture the images was therefore about 20 minutes, largely due to the time spent walking to the stations. Camera stations were not surveyed.
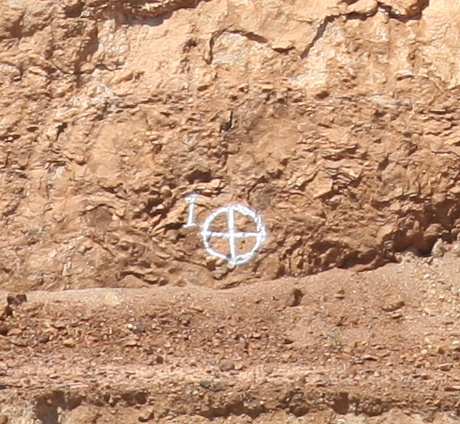
Six control points were painted on the wall, surrounding the area of interest. (These are visible as red dots in the image above.) This is the ideal configuration because it means we’re not extrapolating beyond the controlled area, which tends to magnify any errors in the survey data, although the precise locations are not critical and can easily be varied to take local circumstances into account (in particular, safe access). The control points themselves were simple crosses with a circle around them and their ID painted on the wall next to them to make it easier to identify them later in the images:
For surveying purposes, a semi-permanent network of control points like these would normally be established, allowing future field exercises to simply include images of existing control points within the fan of images. Prisms being used for monitoring can also be used for control. For geotechnical applications, where close inspection of the rock surface is normally required to obtain additional information about the rock mass that is not readily available from photographs, painting of the control points can be combined with the close inspection.
In this particular case the control points were surveyed using a reflectorless total station from the same crest the photographs were captured from. GPS measurement at the time the control point is painted is the other common technique for surveying.
Processing
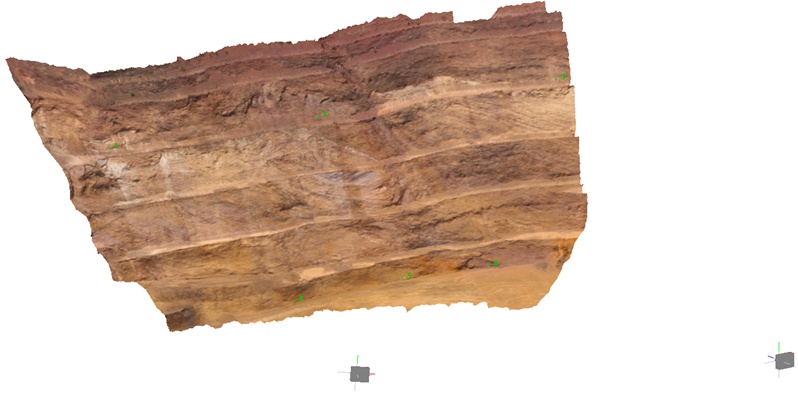
After the fieldwork, the image processing to create DTMs ready for mapping was very straightforward.
It’s useful to break the processing up into different stages based on whether they are human activities or computer activities, because computer activites scale with computer speed while human activities depend more on the user’s proficiency and the quality of the data they have to work with.
| Stage | Activity | Time (m) | Notes |
|---|---|---|---|
| Project Setup | Human | 0.5 | This is a simple project, so setting up two camera stations and dragging six images onto each station takes very little time. |
| Relative-only Point Generation | Computer | 1.0 | The software generates these common points between images with unknown 3D locations to determine the relationship between all of the images in the project. Control points and/or surveyed camera stations are then used to georeference the data in the desired co-ordinate system. |
| Orientations | Human | 3.5 | This includes a relative orientation, automatic removal of any bad relative-only points, digitising control points, an absolute orientation, and an inspection of the Bundle Adjustment Report to verify that no control points show suspicious residuals, no images have suspicious residuals, and the overall residuals are reasonable. |
| Merged Image Creation | Computer | 0.5 | Merging images eliminates the need to carefully line up pairs of images while in the field. |
| DTM Generation | Computer | 2.5 | 1.9 million points generated. |
| Total | 8.0 | (4.0 minutes user time). |
All up, less than 10 minutes between loading the images onto a PC and having the DTMs ready for mapping. The control point RMS’ in this case were 0.041 m in X, 0.022 m in Y, and 0.029 m in Z, for an overall 3D point accuracy of 0.055 m.
According to the calculations given in Part 2, the expected accuracy for this configuration is 20 mm in plan (corresponding to X and Z in this project) and 29 mm in depth (corresponding to Y in this project). Why is it worse?
There are actually two additional, independent sources of error in this case. The first is apparent from looking at the control points themselves — the white lines painted on the rock are 80 mm wide. When the surveyor picked up the location of the centre of the cross using the total station, there is no guarantee that he picked the same point on the ground as I did when digitising that point in the image. One advantage of using circular targets is that the software can find the centre of the target very accurately and, if a prism or other mark is painted right in the centre of the circle, the surveyor can pick up the centre very accurately as well.
The second source of error is, of course, the accuracy of the survey instrument itself. Even if the photogrammetry was infinitely accurate, we would expect the residuals to be the same as the survey accuracy. In this case, the surveyors claimed an accuracy of 50 mm for the control points, which is right in line with the the reported residuals.
Scalability
Suppose we wanted twice as much detail? How much more effort would be required?
Fortunately, in this case, we can answer that directly, because I happened to take images with a 200 mm lens at the same time.
Fieldwork was the same, except this time it took 1.5 minutes per station to capture 23 images from one station and 24 images from the other, rather than 0.5 minutes per station to capture six images at each station. For the processing:
| Stage | Activity | Time (m) | Notes |
|---|---|---|---|
| Project Setup | Human | 0.75 | vs 0.5 minutes. |
| Relative-only Point Generation | Computer | 5.25 | vs 1.0 minutes. |
| Orientations | Human | 4.0 | vs 3.5 minutes. |
| Merged Image Creation | Computer | 1.5 | vs 0.5 minutes. (210 megapixels vs 65 megapixels.) |
| DTM Generation | Computer | 7.0 | vs 2.5 minutes. (7.9 million points vs 1.9 million points.) |
| Total | 18.5 | (4.75 minutes user time). |
The total time more than doubled, but four times as many images were processed and four times as much data was generated. The user time also only increased slightly, and the time that the computer was busy actually become long enough that the user could profitably spend it doing something else (e.g. setting up another project ready for processing, checking email, or getting a cup of coffee). In fact, it’s quite common that as the project scales up, total time scales up as well but so does user efficiency — the total user time amounted to 6 seconds/image in the 200 mm project but 20 seconds/image in the 100 mm project. (Total time was 24 seconds/image vs 40 seconds/image.)
Predictably, the accuracy as indicated by the control point residuals did not improve at all, proving that the photogrammetry was not the limiting factor. For geotechnical analysis this isn’t an issue — the driving concern in this case is obtaining enough detail to resolve the smallest features of interest. For surveying, however, it is more efficient to match the accuracy of the control survey to the expected accuracy of the photogrammetry rather than spend more time improving the accuracy of one when the overall accuracy isn’t going to improve. (There is one small caveat to this observation — because the photogrammetry is doing a “best fit” to the control point observations, it has the ability to increase the accuracy beyond the native accuracy of the control points themselves in exactly the same way that the average of repeated, independent measurements of something will be more accurate than each individual measurement. However, this can only reduce random error, not systematic error; if the total station operator set up over the wrong location, for example, all of the data would be offset because of that and the photogrammetry would be unable to compensate.)
From the above timings it’s pretty clear that the fieldwork, and in particular the control point placement, can be a major factor in the time required for a project. Ideally, semi-permanent markers can be used, which allows the effort required in placing and surveying them to be amortised over many field exercises. Sometimes, however, marking and surveying control points is not the preferred option, so the next two case studies explore two alternatives.
Case Study 2: Image Fans, “Natural” Control
Fieldwork
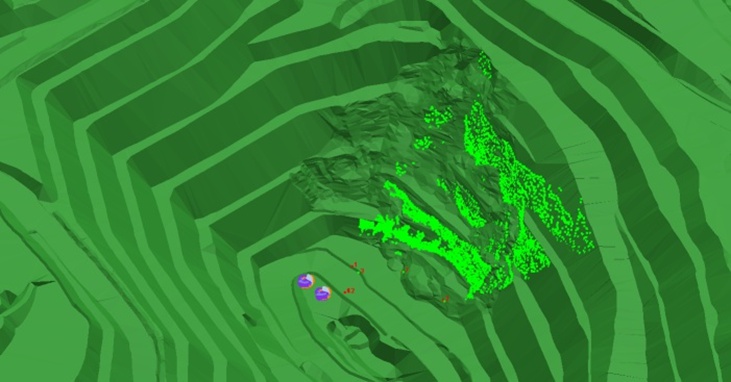
In this second example, the objective was to survey a failure. The project area was 200 m × 200 m. A Canon EOS 5D with 50 mm lens gave a 3 cm ground pixel size at a range of 180 m.
The camera stations were 25 m apart, giving a base:distance ratio of 1:7.
Two images were captured at one station and three at the other. Coupled with the short distance between stations, this means that the image capturing itself was extremely quick. Camera stations were not surveyed, but a total of 10 interesting points on the pit wall and nearby (a delineator, the top of a sign, and distinctive rocks) were surveyed with a reflectorless total station. By far the majority of the time was in setting up the total station itself, which was done in parallel to the image capturing.
Processing
Processing-wise, the only difference between this project and the first one is that the control points were not clearly marked in the images. Since the user must digitise at least three of the surveyed points by hand, some record of what each control point represents is required. (The user can ask the software to locate the remaining points, and as long as there is something special about the location it shows — say, a white rock on a red background — then the user can usually guess reasonably well what the total station operator chose to pick up.)
| Stage | Activity | Time (m) | Notes |
|---|---|---|---|
| Project Setup | Human | < 0.5 | With even fewer images than the first project, setting this up is extremely simple. |
| Relative-only Point Generation | Computer | 0.2 | Actually, less than 10 seconds. |
| Orientations | Human | 3.5 | |
| Merged Image Creation | Computer | 0.5 | 2 × 30 megapixels |
| DTM Generation | Computer | 2.0 | 0.6 million points generated. |
| Total | 6.7 | (4.0 minutes user time). |
Control point residuals were 0.015 m in X, 0.005 m in Y, and 0.006 m in Z and ranged from 25 m away to 200 m away. Expected planimetric accuracies range from 0.002–0.017 m and depth accuracies from 0.015–0.120 m so accuracies were actually better than expected, especially since many of the control points were the centres of quite large rocks.
Case Study 3: Surveyed Camera Stations
Fieldwork
Another option is to substitute surveyed camera stations for control points. Since we need at least three surveyed locations (not in a straight line) to georeference a project, to eliminate control points entirely requires three camera stations (not in a straight line) to be used.
In this case, the Canon 5D was equipped with a 28 mm lens and three images were captured in a triangular configuration about 25 m apart from each other. The camera was handheld and the GPS receiver was simply placed above the camera to take a reading at the same time the images were captured. The total time was less than 2 minutes.
If more accuracy is required, ADAM’s camera mount is equipped with an optional tribrach adapter that allows it to be mounted directly onto a standard set of survey legs. This makes it simple to survey camera stations — simply remove the camera and place the GPS receiver immediately on top.
Since the controlled area is relatively small, any errors in the surveyed locations are going to be extrapolated in proportion to the distance to the area of interest. To reduce this problem, camera stations can be placed further apart, and even lenses changed if required to keep the ground pixel size comparable between different locations.
Processing
With only three images on three camera stations and no image fanning or control points to digitise, this project is extremely simple.
| Stage | Activity | Time (m) | Notes |
|---|---|---|---|
| Project Setup | Human | < 0.5 | |
| Relative-only Point Generation | Computer | 0.2 | The actual relative-only point generation was less than 5 seconds. |
| Orientations | Human | 0.2 | With no control points to digitise, this was a simple matter of doing a relative orientation followed by an absolute. |
| DTM Generation | Computer | 0.8 | 250 thousand points generated. |
| Total | 1.7 | (0.7 minutes user time). |
It’s a little difficult to talk about accuracy in this case because only three surveyed camera stations were used, giving very little redundancy and therefore little opportunity to glean something meaningful from the residuals. Adding a fourth camera station and/or one or more control points in the field of view would help.
In future articles I’ll look at more examples, including projects where images were captured from moving vehicles — both terrestrial and aerial. In the meantime, I hope you have a Merry Christmas and a Happy New Year!
Pingback: Aerial Mapping with UAVs and 3DM Analyst Mine Mapping Suite « ADAM Technology Team Blog